
Letter from Prof. Nickolas J. Themelis1 and all members of the Global WtERT Council2 an international consortium of universities representing 24 Nations to Organizing Committee of COP27
- Earth Engineering Center, Columbia University (https://earth.engineering.columbia.edu)
- Global Waste-to-Energy Research and Technology Council, (wtert.org)
We like to bring to your attention that the generation of methane from waste dumps and landfills is one of the main sources of greenhouse gas emissions to the atmosphere. According to a 2018 study by the World Bank12, about 1.2 billion tons of post-recycling solid wastes are landfilled annually. The average amount of methane generated in landfills was estimated11 to be 0.05 tons methane per ton of wastes landfilled. The Intergovernmental Panel for Climate Change (IPCC) has estimated that, for a 100-year horizon, the effect of one ton methane is equivalent to 25 tons of carbon dioxide; while for a 20-year horizon the methane to CO2 equivalence is 72. Based on the above numbers, the global generation of methane from landfilling is equivalent to somewhere between 1.5 to 4.3 billion tons of carbon dioxide. Some of the landfill methane is captured in sanitary landfills; for example, the U.S. landfills capture an estimated 100 million tons of carbon dioxide equivalent11. A series of recent studies, using direct measurements of methane plumes from landfills, have shown that measured emissions average over twice the modeled emissions reported in current GHG inventories[i]–[vi]. Based on this growing set of data, landfill methane emissions are comparable to the methane emissions from the entire agricultural sector.[vii]
Economic development and urbanization since 1950 have been accompanied by an enormous increase in urban wastes, estimated by a World Bank 2018 report13 to be two billion tons and projected to double in the coming decades. Waste management has become the major cost item of developed cities (e.g., $1.8 billion for New York City) and a major environmental problem of cities in the developing world. The “hierarchy” of waste management (see below) is an illustration of the principal ways of dealing with urban wastes. Reduction, recycling, and composting are at the top of this “hierarchy” but international experience has shown that there remains a post-recycling fraction that traditionally is landfilled; it ranges from 50% of the total urban wastes, e.g. in some European countries, to 90 % parts of the developing world. However, in the last thirty years, an alternative has been developed: Combustion of urban wastes in specially designed power plants that produce electricity and heat and also recover metals and minerals. This “Waste-to-Energy” (WtE) technology is now used to process over 300 million tons of urban wastes, i.e., nearly at the same scale as the global recycling efforts. All the post-recycling waste of Japan and several European countries, nearly one half of China, and one tenth of the U.S. are processed in energy recovery plants. Also, many small developing countries, have built or are building waste-to-energy (WtE) power plants.
The goal of COP27 and its predecessors is to reduce the emission of greenhouse gas and mitigate the already experienced catastrophes of climate change. It is obvious that this can only be done by decisive action on many fronts. A very important one is to reduce landfilling by providing policies and incentives that expand the application of the existing alternative technology, the recovery of energy and materials from urban wastes (WTE).
Methane is the 2nd largest driver of anthropogenic climate change.[viii] According to the United Nations Environment Programme (UNEP), “cutting methane is the strongest lever we have to slow climate change over the next 25 years.”[ix] In the near-term, reducing emissions of Short-Lived Climate Pollutants like methane is more effective than reducing CO2.[x] The IPCC 6th Assessment Report8 notes that methane reduction “stands out as an option that combines near- and long-term gains on surface temperature and leads to air quality benefits by reducing surface ozone levels globally.”
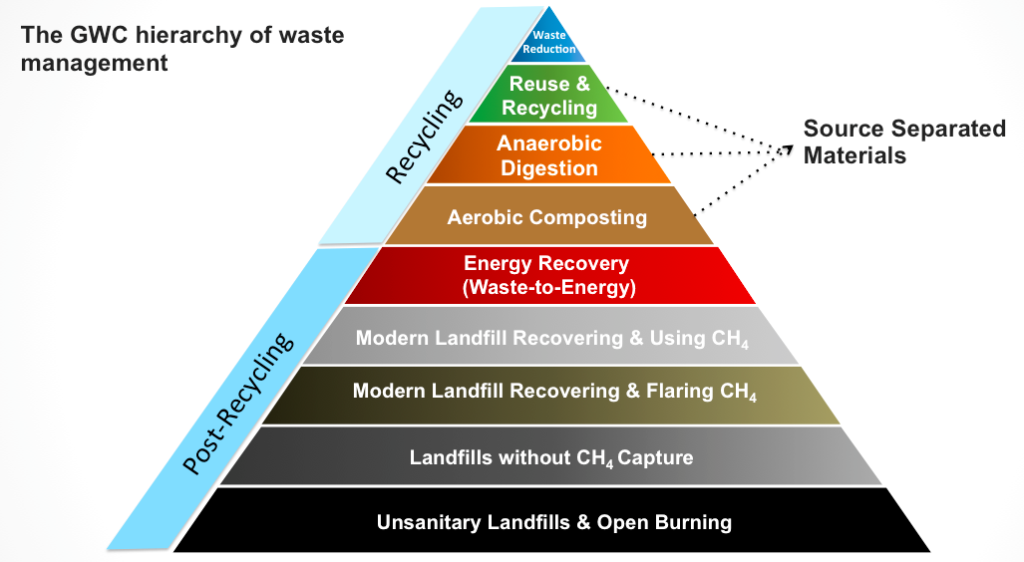
“Hierarchy” of waste management (EEC, Columbia University)
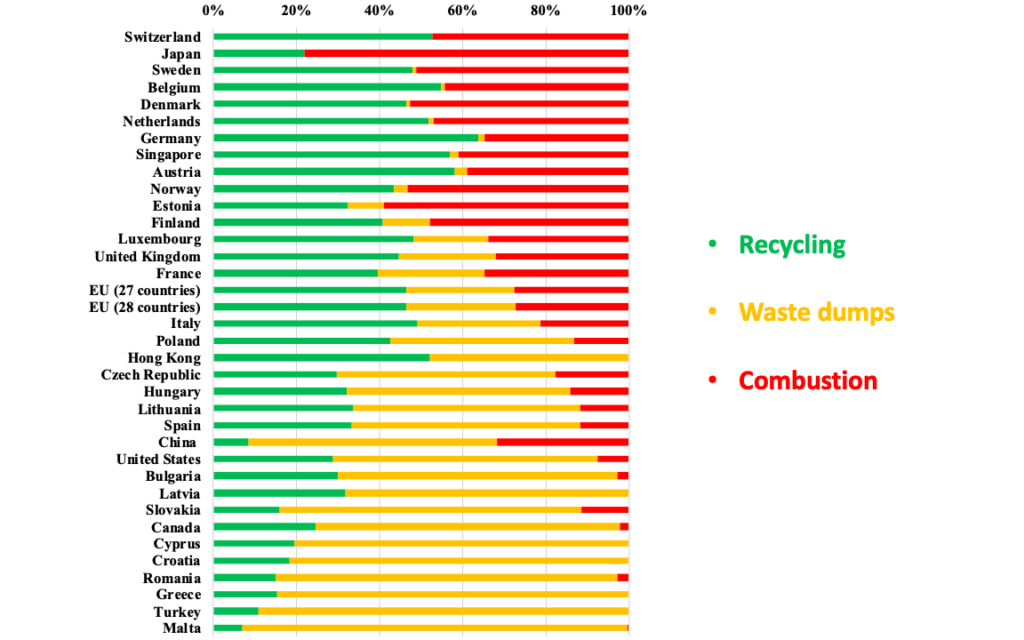
Disposition of urban wastes in 2015 (EEC, Columbia University)
Email: N.J. Themelis: njt1@columbia.edu ; website: wtert.org;
Social media links: twitter.com/globalwtert / facebook.com/globalwtert / instagram.com/globalwtert
References:
- Peischl et al. (2013) Quantifying sources of methane using light alkanes in the Los Angeles basin, California, Journal of Geophysical Research: Atmospheres, 118: 4974-4990. https://doi.org/10.1002/jgrd.50413
- Wecht et al. (2014) Spatially resolving methane emissions in California: constraints from the CalNex aircraft campaign and from present (GOSAT, TES) and future (TROPOMI, geostationary) satellite observations, Atmos. Chem. Phys. 14, 8173-8184. https://www.atmos-chem-phys.net/14/8173/2014/acp-14-8173-2014.pdf
- Cambaliza et al. (2015) Quantification and source apportionment of the methane emission flux from the city of Indianapolis, Elementa: Science of the Anthropocene, 3:37. https://www.elementascience.org/articles/10.12952/journal.elementa.000037/
- Cambaliza et al. (2017) Field measurements and modeling to resolve m2 to km2 CH4 emissions for a complex urban source: An Indiana landfill study, Elem Sci Anth, 5: 36, https://doi.org/10.1525/elementa.145
- Ren et al. (2018) Methane Emissions From the Baltimore‐Washington Area Based on Airborne Observations: Comparison to Emissions Inventories, Journal of Geophysical Research: Atmospheres, 123, 8869–8882. https://agupubs.onlinelibrary.wiley.com/doi/pdf/10.1029/2018JD028851
- Jeong, S., et al. (2017), Estimating methane emissions from biological and fossil-fuel sources in the San Francisco Bay Area, Geophys. Res. Lett., 44, 486–495 https://agupubs.onlinelibrary.wiley.com/doi/full/10.1002/2016GL071794
- Total 2019 U.S. landfill methane emissions, as reported in U.S. EPA (2021) were 4.58 MMT CH4. On average, measured landfill emissions from recent data referenced herein were 2.3X greater than reported. Adjusting U.S. inventory with this factor yields total landfill emissions of 10.5 MMT CH4. Total agricultural sector emissions, inclusive of enteric fermentation, manure management, rice cultivation, and field burning of agricultural residues were 10.26 MMT CH4.
- IPCC, 2021: Climate Change 2021: The Physical Science Basis. Contribution of Working Group I to the Sixth Assessment Report of the Intergovernmental Panel on Climate Change [Masson-Delmotte, V., P. Zhai, A. Pirani, S. L. Connors, C. Péan, S. Berger, N. Caud, Y. Chen, L. Goldfarb, M. I. Gomis, M. Huang, K. Leitzell, E. Lonnoy, J. B. R. Matthews, T. K. Maycock, T. Waterfield, O. Yelekçi, R. Yu and B. Zhou (eds.)]. Cambridge University Press. In Press. https://www.ipcc.ch/report/ar6/wg1/#FullReport
-
United Nations Environmental Program (UNEP) (2021) Global Methane Assessment: Benefits and Costs of Mitigating Methane Emissions, https://www.unep.org/resources/report/global-methane-assessment-benefits-and-costs-mitigating-methane-emissions
- Hu et al. (2013) Mitigation of short-lived climate pollutants slows sea-level rise, Nature Climate Change, 3, 730-734. https://www.nature.com/articles/nclimate1869
- Themelis, N.J., Bourtsalas, A.C., Methane Generation and Capture of U.S. Landfills, Journal Environmental Science and Engineering, p.199, 2021 (htttps://www.davidpublisher.com/Public/uploads/Contribute/61ad830cee8a6.pdf)
- Kaza, S.; Yao, LC, Bhada-Tata, P. et al.; What a Waste 2.0 : A Global Snapshot of Solid Waste Management to 2050, World Bank 2018 (https://openknowledge.worldbank.org/handle/10986/30317)