Frequently Asked Questions (FAQs)
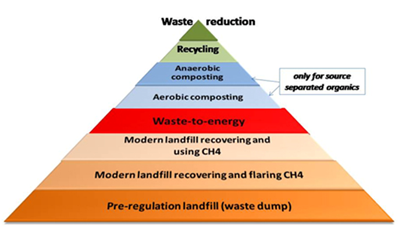
It is a graphical way of showing the priorities for managing solid wastes. The first priority is to avoid the generation of wastes (e.g., reduced consumption of goods, less packaging) followed by recycling (paper, metals, plastics) and composting of source-separated organic wastes, followed by combustion with energy recovery (“waste-to-energy”), and finally landfilling. However, not all landfills are the same. Modern “sanitary” landfills require a serious investment and effort to protect surface and ground water and to collect landfill gas (LFG) and use it to generate energy.
The tonnages of MSW generated, recycled/composted, treated by WTE, and landfilled in the fifty states of the U.S. in 2010 (BioCycle/Columbia State of Garbage Survey) can be seen in this here (SoG 2010).
Depending on the location, size, and other factors, the capital cost per annual ton of WTE capacity ranges from about $650/annual ton of capacity, for a recent plant in Florida, to $240/ton, for several modern plants in China.
WTE plant processing typical MSW will generate a net of 500-600 kWh per ton for use by the local utility. At the price of six cents per kWh, the revenues per ton of MSW would be $30-36.
Yes, many E.U. plants co-generate electricity (500 KWh per ton) and district heating (1000 KWh per ton). For example, 30% of Denmark’s district heating is provided by their 28 WTE plants.
In addition to the capital charges, a 1000-ton per day plant would engage personnel of about 60. Other costs are services, materials and supplies and the cost of disposal of ash.
- The value of the electrical energy generated.
- The gate fee (“tipping” fee) paid by municipalities using the WTE facility.
- The value of the ferrous and non-ferrous scrap collected.
- The value of co-generated heat that is used by adjacent industrial plants or for district heating.
- As climate change becomes more evident (e.g. the Sandy storm of 2012), WTE plants will also benefit from carbon credits for renewable energy. For example, China already provides a $30/MWh credit to electricity generated by WTE plants.
It ranges from 15-25% by weight of the MSW processed and about 10% of the volume of the MSW processed. About 85% of the ash is bottom ash that in the E.U. is used for road construction. In the U.S. the mixed “combine ash” is used as an alternative daily cover in landfills, instead of soil.
- WTE plants conserve fossil fuels by generating electricity. One ton of MSW combusted reduces oil use by one barrel (i.e., 35 gallons) or 0.25 tons of high heating value coal.
- WTE has much lower equivalent carbon emissions (see Question on landfilling below).
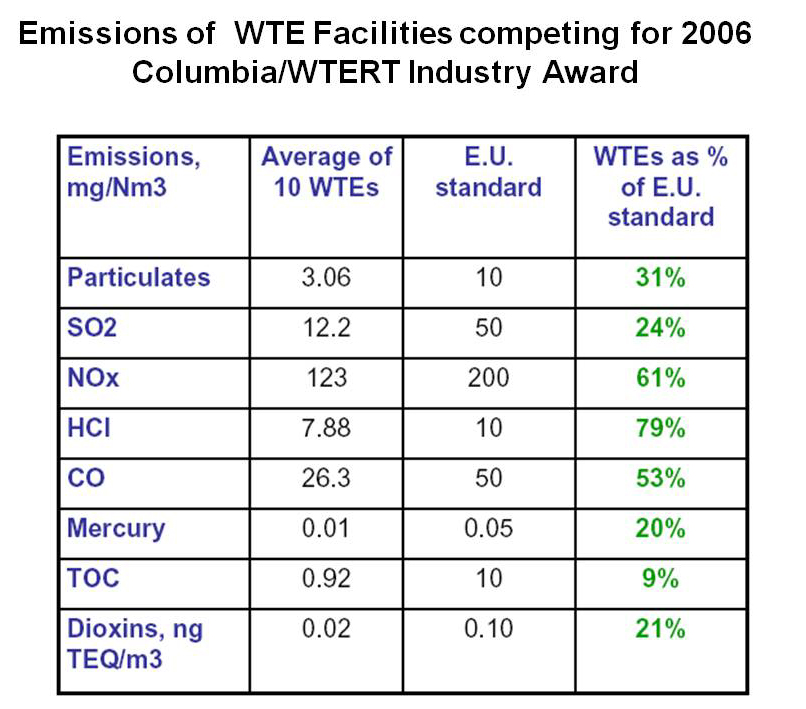
- The following figure shows the average emissions of ten WTE facilities – four from the U.S. – that participated in the WTERT 2004 competiton for “one of the best WTEs in the world (won by the Brescia, Italy WTE). It can be seen that the WTE emissions were well below the European, and also the U.S. standards.
- WTE plants do not have the aqueous emissions that may be experienced in landfills, either now or in the distant future.
- WTE plants reduce the space required for landfilling by about 90% (one square foot per ton of MSW).
Americans generate about 1.3 short tons of MSW per person, each year. The 2002 BioCycle/Columbia University national survey showed that Americans recycle about 19.5% of the MSW generated, compost an additional 9%, combust in WTE facilities 8% and landfill about 63% . The Earth Engineering Center of Columbia University has estimated that of the present MSW generated in the U.S., at the most 40% can be recycled or composted. Therefore, the maximum possible MSW available for combustion in modern WTE facilities will be 60%, instead of the present 8%.
There are economies of scale in any construction project, and building a WTE plant is no exception. Larger plants result in lower costs per ton of MSW processed. In the U.S., most WTE facilities range from 500 to 3,000 tons per day. In the E.U., smaller plants are all operating.
A WTE facility requires a site, first and foremost, that is properly zoned and near major roads, highways, a utility substation, and has water, sewage and an appropriate industrial infrastructure. Twenty-five acres is preferred, but some facilities are located on as little as 5 acres if trucks can line up off site. Before construction can begin, a projects needs to secure the following:
- Waste characterization in terms of composition, heating content, moisture, etc.
- Site control through lease or ownership.
- Proper zoning and/or land use conformance.
- Environmental permits.
- Utility interconnections.
- Power purchase agreement including off-take guarantees.
- Materials purchase agreements.
- Ash disposal (landfill) capacity.
- Waste supply commitments.
- Acceptable credit worthiness of all project participants including the government, bank utility or other entity require to make financial guarantees.
- Guarantees including governmental entities at the federal, state, and local levels.
- Current cost of waste disposal.
- Availability and cost of disposal alternatives.
Once the site and all contracts are secured, the facility may be financed and construction can begin. The construction period lasts approximately 24-30 months.
In the U.S., there are 87 WTE facilities located in 29 states. For a detailed list, look up www.wte.org or look up Global WTE in this web page.
Many WTE facilities combust special, non-hazardous wastes such as off-specification household products and goods that cannot be recycled. In fact, WTE is a preferred method for some manufactures to dispose of pharmaceuticals and of law enforcement agencies seeking to destroy controlled substances that are no longer needed as evidence in criminal trials. To determine whether a WTE facility accepts non-hazardous commercial or special waste, review the list of facilities in your area and contact the operator of the facility. In fact, all types of waste can be combusted in a properly designed WTE with the exception of radioactive wastes.
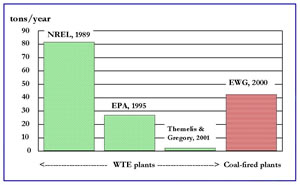
The WTE industry receet the EPA’s New Clean Air Act “Maximum Control Technology” (MACT) standards. In a 2002 letter, U.S.E.P.A. Assistant Administrators Jeffery Holmstead, Office of Air and Radiation, and Marianne Lamont Horinkontly completed a more than $1 billion retrofit to existing facilities to me, Office of Solid Waste and Emergency Response, recognized the “vital role of the nation’s municipal waste-to-energy industry” and concluded that “these plants produce 2800 megawatts of electricity with less environmental impact than almost any other source of electricity.” The Table below shows the dioxin/furan TEQ emissions in the U.S. from various sources that also include WTEs. The following figure compares mercury emissions from WTEs and coal-fired power plants in the U.S.
In the U.S., most of today’s operating WTE plants were built in the period of 1980-1995. Energy prices and landfill disposal costs dropped in the mid-1990’s making WTE plants more difficult to develop. However, new WTE units have been built or are under construction in Florida and Hawaii. Crowded urban areas and locations where groundwater is close to the surface benefit most from WTE facilities. Abroad, there have been over 200 new WTE plants built since 1996 and some are under construction. In all there are over 700 WTE plants in the world located in 37 nations, including Bermuda, Singapore and China. New WTEs are under construction in the U.K., Azerbaijan and other nations.
Generally, WTE residues can be differentiated into two fractions: The term fly ash refers to the fine particles that are removed from the flue gas. However, usually the fly ash includes also residues from other air pollution control devices, such as scrubbers. Fly ash typically amounts to 10-20% by weight of the total ash.
The rest of the WTE ash is called bottom ash (80-90% by weight). The main chemical components of ash are silica (sand, quartz), CaO, Fe2O3, and Al2O3 for a mass burn WTE plant. Usually the ash has a moisture content of 22-62% by dry weight. The chemical composition of the ash depends strongly on the original MSW feedstock and the combustion process.
Dr. Jurgen Vehlow of Karlsruhe Research and an EEC Research Associate has compiled ash composition data from several studies (see figure below). E.g. Hg can vary from 0.1 to 10 ppm in bottom ash and from 1 to 30 ppm in fly ash (before treatment).
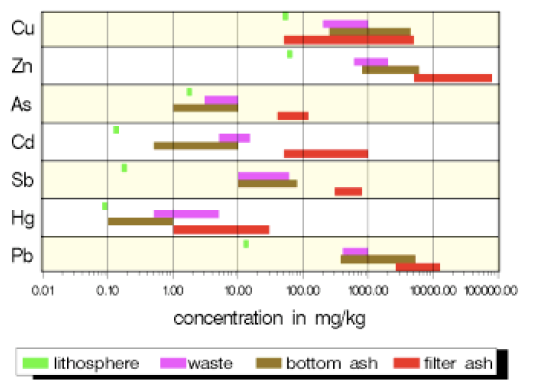
WTE ash has been reused in construction since the early 70’s. Common applications are sub-base material, structural fill, and aggregate in asphalt or concrete. However, in the past, contaminant concentrations of fly ash exceeded the allowable threshold values. Ash reuse is therefore restricted to proven processes. Because there are no nationwide standards in the U.S. less than 5% of the WTE ash is beneficially used (compared to bottom ash reuse of ~70% in Germany and ~90% in the Netherlands). The government of Bermuda uses the entire WTE ash in concrete products for artificial reefs or shore abatements. The Waste-to-Energy Research and Technology Council is therefore taking an innovative approach towards our understanding and beneficial use of ash. An interdisciplinary and inter-institutional research group will carry out a comprehensive project on reuse applications such as engineered aggregate, cement blocks, asphalt, remediation of brownfields and abandoned mines, and concrete. One of the main goals is to recommend authoritative, nationwide standard specifications.
Ashes that cannot be reused are landfilled. Usually, combined WTE ashes do not qualify for unrestricted disposal but are placed in monofills while it is easier to place bottom ash alone because it rarely exceeds the maximum permitted concentrations for landfilling. In contrast, fly ash alone may have to be handled as hazardous waste and thus introduces additional problems if not stabilized prior to its disposal.
WTE facilities are primarily regulated under the federal Clean Air Act and the Resource Conservation and Recovery Act. The Clean Air Act requires plants to obtain permits whose provisions are based on plant size and technology. Federal and state regulators enforce emissions limits for sulfur dioxide, hydrogen chloride, nitrogen oxides, carbon monoxide, particulates, cadmium, lead, mercury, and dioxins. Operating conditions, monitoring, reporting, training and safety requirements also apply under the Clean Air Act. The Resource Conservation and Recovery Act requires testing of the plants’ ash residue to determine that the ash is non-hazardous and properly disposed or reused. States often take authority for enforcement of the regulations and require even stricter environmental limits on the facilities’ operation than imposed by the federal rules. State-specific requirements can include more strict emission limits, testing or reporting than federal rules; additional solid waste management, recycling, noise, site selection, transportation and related regulations; and water use or waste water management limits.
The dominant technology is mass burning and the foremost process used is that developed by Martin (Munich, Germany) with installed annual capacity of about 60 million metric tons. AE&E Company (Von Roll technology) mass burn process follows with 35 million tons worldwide. Other mass burning technologies are the roller grate (DB), Westinghouse process, the Keepel-Seghers process, and the Fisia Babcock process. There are several plants in the U.S. based on the Refuse-Derived Fuel (RDF) process that pre-shreds the waste into small pieces and separates some of the non-combustible materials (metals and glass).
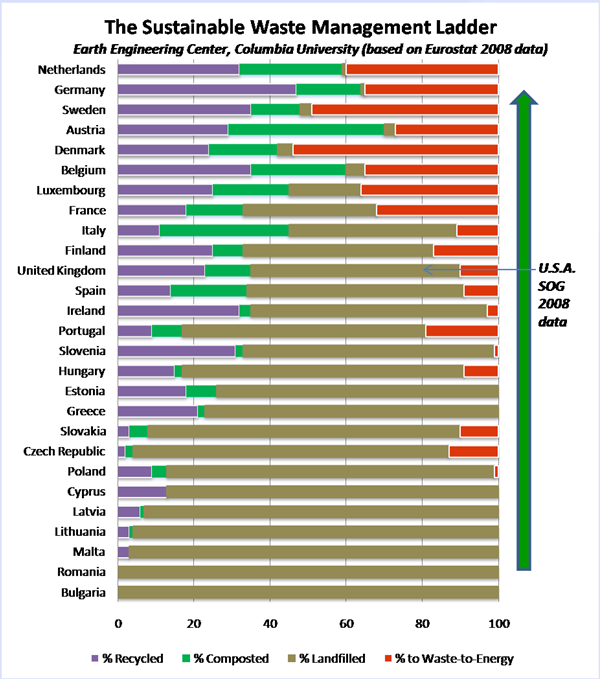
As a rule, the communities that invest in WTE plants, because of the energy and environmental benefits described above, also do as much as possible recycling before sending the non-recyclable waste to their WTE. Despite all good intentions and efforts some waste materials are not recyclable economically in the U.S. because of the comparatively low cost of fossil fuels. For example, out of the 25 million tons of plastics generated annually in the U.S., only 1.5 million tons are recycled, 3.5 million are combusted and 20 million tons are landfilled, despite the fact that their heating value is higher than the best U.S. coal. The graph below shows that nations that have practically eliminated landfilling have done so, invariably, by a combination of recycling and WTE.
It is easy to juggle % recycling rates but the real evidence of sound waste management is provided by how many tons of MSW a city landfills. The official SF web page, SFgov.org, reports that SF generates 4,000 tons MSW per day of which 60% is landfilled. Therefore, SF citizens (population 760,000) landfill 0.96 tons per capita which is slightly higher than the California average of 0.9 tons and nearly the same as NYC. Tourist destinations usually generate more MSW per capita.
Dioxin formation and emissions are not related to the MSW feed but to the performance of the Air Pollution Control (APC) system of the facility. Testing the APC once a year (three tests over an eighteen hour period) for dioxins is adequate, similarly to the annual car emissions test required by New York and other states.
Some dioxins are toxic (EPA has determined that 50 grams of measured total dioxins are equivalent to 1 gram of toxic dioxins – 1 gram TEQ). However, dioxins exist in nature as a result of both human (biomass, coal and MSW combustion, metal production, etc.) and natural (forest fires, volcanoes) activities. Fifteen years ago, EPA reported dioxin emissions of 12,000 grams TEQ. As a result of implementation of the Maximum Achievable Control technologies (MACT) of EPA, the US emissions have decreased by now to about 1,200 grams TEQ (12 grams from WTE, 60 grams for coal-fired power plants, 500 from “backyard burning””). It should be noted that even when dioxin emissions were ten times higher than are now, there has not been a single recorded evidence of a person becoming ill or dying from dioxin poisoning in the U.S. Apart form the Seveso (Italy) industrial chemical accident and the allegations regarding the use of Agent Orange in the Vietnam war, the only reported case of dioxin poisoning was recently when an undetermined quantity of dioxins was mixed in the food of Mr. Yushchenko, the current President of Ukraine. He has survived this attack.
Landfilling is cheaper except in cases like New York City where the MSW has to be transferred long distances. For example, in the case of NYC, the landfilling fee is about $30 but the truck transport costs an additional $70. However, when the “external” environmental costs are factored in, WTE is less expensive in all cases. For one thing, the constantly increasing use of land for landfilling is not sustainable. In the case of the Freshkills landfill of New York City, about 3,500 acres of land were lost to landfilling over a period of fifty years. The burden has now been shifted to Pennsylvania and other states but to this has been added the environmental cost of truck transport of MSW from NYC to PA.
Comparing with landfills that do not recover any LFG (i.e., 80% of the world’s landfills), the WTE advantage over landfilling, including GHG reduction and electricity generation is one ton CO2/ton MSW. Comparing with landfills that practice LFG recovery and thus recover 50% of LFG, reduces the WTE advantage to about 0.5 ton CO2/ton MSW.

Welcome to SOFOS: A Comprehensive Online Database
Managed by WtERT® and the Earth Engineering Center at Columbia University, SOFOS is a vast collection of research dedicated to the advancement of sustainable waste management that promotes knowledge sharing through numerous publications, dissertations, and studies.
Reinforce Your Knowledge by exploring our database. Enter your search inquiry below:
